 Functional Analysis and Classification of Phytoplankton Based on Data from an Automated Flow Cytometer.
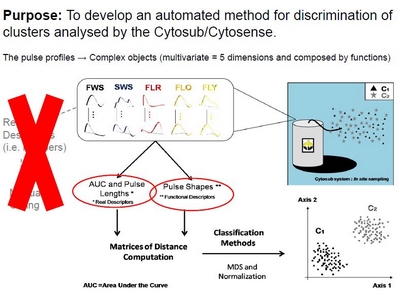
Anthony MALKASSIAN, David NERINI, Mark A. van DIJK, Melilotus THYSSEN, Claude MANTE, and Gerald GREGORI. Flow cytometry is a useful tool to analyse phytoplankton communities in the ocean. By measuring the light scatter, diffraction and fluorescence property on each particle, this provides a fingerprint which enables groups to be separated. A new flow cytometer called Cytosub has been developed for autonomous in situ sampling, allowing us to follow phytoplankton dynamics at short temporal scale. This instrument is able to record full pulse shape information for each particle analysed on each variable, generating large and complex data sets. Usually manual analysis is performed and typically consists of visualizing the data set with histograms and two- or three-dimensional scatterplots, and to identify the groups by drawing boxes around them. Our purpose is to provide more objectivity in the data analysis by applying an automatic and consistent method to discriminate groups analysed by the Cytosub. In other words, we seek for partitioning methods on the optical fingerprints of particles, which are complex objects (i.e. 5 profiles) by taking into account the shape of each pulse, their length and amplitude.

In a preliminary step, numerical experiments are done on simulated profiles. Then the method is applied and validated on mixed phytoplankton cultures, for which clusters overlap considerably.
In order to share this methods we believe it is absolutely necessary to provide the cytometry community with the R code as well as the very example datasets we used, so our experiments can be repeated and analytical methods can be further enhanced.
This work is in press in Cytometry part A. (Anthony MALKASSIAN, David NERINI, Mark A. van DIJK, Melilotus THYSSEN, Claude MANTE, and Gerald GREGORI. Functional Analysis and Classification of Phytoplankton Based on Data from an Automated Flow Cytometer. Cytometry part A).
Documents:
– 20_strains_experiment
– Phytoclus_R_script_with_functions-2
– Numerical_simulations-2
